The COVID-19 pandemic has reshaped how we understand contagion, not just biologically but socially. Among the most fascinating developments in this space is the emergence of mathematical pandemic sandbox models that simulate how viruses spread through social networks. These digital laboratories allow researchers to tweak variables—human behavior, vaccination rates, mobility patterns—and observe potential outcomes without real-world consequences. What began as an academic exercise has now become a critical tool for policymakers grappling with the next wave or variant.
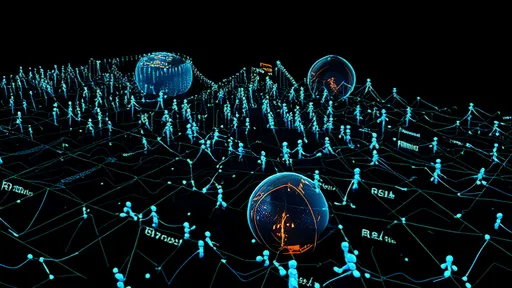
At the heart of these simulations lies graph theory, a branch of mathematics that maps relationships between interconnected nodes. In this context, each node represents an individual, and edges symbolize social interactions. By adjusting the weight of these edges—say, reducing contact frequency to mimic lockdowns—the model predicts how quickly an infection might propagate through a community. Unlike traditional epidemiological models that treat populations as homogeneous blobs, network-based approaches capture the unevenness of human interaction. Super-spreaders, isolated individuals, and clustered families all play distinct roles in the digital replica.
One particularly revealing insight from these sandboxes is the non-linear impact of social distancing. Early assumptions suggested that cutting all contacts by 50% would simply halve transmission rates. But network models show something more nuanced: targeted reductions in high-risk interactions (like crowded indoor gatherings) yield disproportionately large benefits compared to blanket restrictions. This helps explain why some countries fared better with nuanced guidelines rather than draconian lockdowns.
The technology isn’t without limitations, however. Garbage in, garbage out remains a cardinal rule. If initial assumptions about network structures are flawed—for instance, underestimating how often college students socialize across dormitories—the simulation’s predictions may veer into fantasy. Researchers combat this by layering real-world data onto their models: mobile location pings, census demographics, even anonymized social media connections. The goal is to create a digital twin of society that’s messy enough to be believable.
Perhaps the most provocative finding from these virtual experiments concerns the paradox of partial compliance. When 70% of a population diligently follows masking rules while 30% flout them, the virus doesn’t simply spread at 30% efficiency. Network effects create pockets of vulnerability where the non-compliant group acts as an accelerant, undermining the majority’s efforts. This mathematical reality has fueled debates about enforcement strategies versus voluntary adoption.
Looking ahead, these models are evolving beyond pandemic response. Public health agencies now explore applications for mental health contagion, misinformation spread, and even urban planning. How does a viral tweet behave like a pathogen? Can depression cluster like an airborne disease? The mathematical frameworks built for COVID-19 are proving startlingly versatile. As one researcher quipped, "We accidentally created a microscope for social physics."
Ethical questions loom large, naturally. Who gets access to these powerful simulation tools? Should corporations use them to optimize workplace policies, or would that cross into surveillance overreach? The sandboxes also force uncomfortable calculations about tradeoffs—how many ICU admissions are "acceptable" to keep schools open? There are no easy answers, but the models make the choices starkly visible.
What began as lines of code and abstract equations now holds up a mirror to our interconnectedness. The simulations confirm what poets knew all along: no one is an island, at least not epidemiologically. As these tools grow more sophisticated—incorporating AI, real-time data streams, and multilayer network effects—they may well redefine how we navigate not just pandemics, but all collective crises of the future.

By /Aug 5, 2025

By /Aug 5, 2025

By /Aug 5, 2025

By /Aug 5, 2025

By /Aug 5, 2025
By /Aug 5, 2025

By /Aug 5, 2025

By /Aug 5, 2025

By /Aug 5, 2025

By /Aug 5, 2025

By /Aug 5, 2025

By /Aug 5, 2025

By /Aug 5, 2025
By /Aug 5, 2025

By /Aug 5, 2025

By /Aug 5, 2025

By /Aug 5, 2025

By /Aug 5, 2025

By /Aug 5, 2025

By /Aug 5, 2025